
Most buildings track elevator data. Few use it to understand what’s actually changing.
Most buildings today are collecting more elevator data than ever before.
But very little of it is being used to its full potential.
Because most systems are designed to answer a simple question:
“Is something wrong?”
The more useful question is:
“What is this system trying to tell us before anything breaks?”
Not All Data Is Created Equal
When people think about elevator monitoring, they usually think in terms of failures:
- A fault code triggers
- A component stops working
- An alert gets sent
That’s the obvious layer.
But underneath that is a much quieter—and far more valuable—set of signals:
- Slight increases in door dwell time
- Small delays in floor-to-floor travel
- Changes in motor temperature under similar load conditions
- Irregular call patterns at certain times of day
Individually, none of these mean much.
But together, they start to form a pattern.
Patterns Show Up Long Before Problems Do
Most mechanical issues don’t appear suddenly.
They develop gradually.
A door operator doesn’t just fail—it starts closing a fraction of a second slower.
A drive system doesn’t overheat instantly—it runs slightly warmer under the same demand.
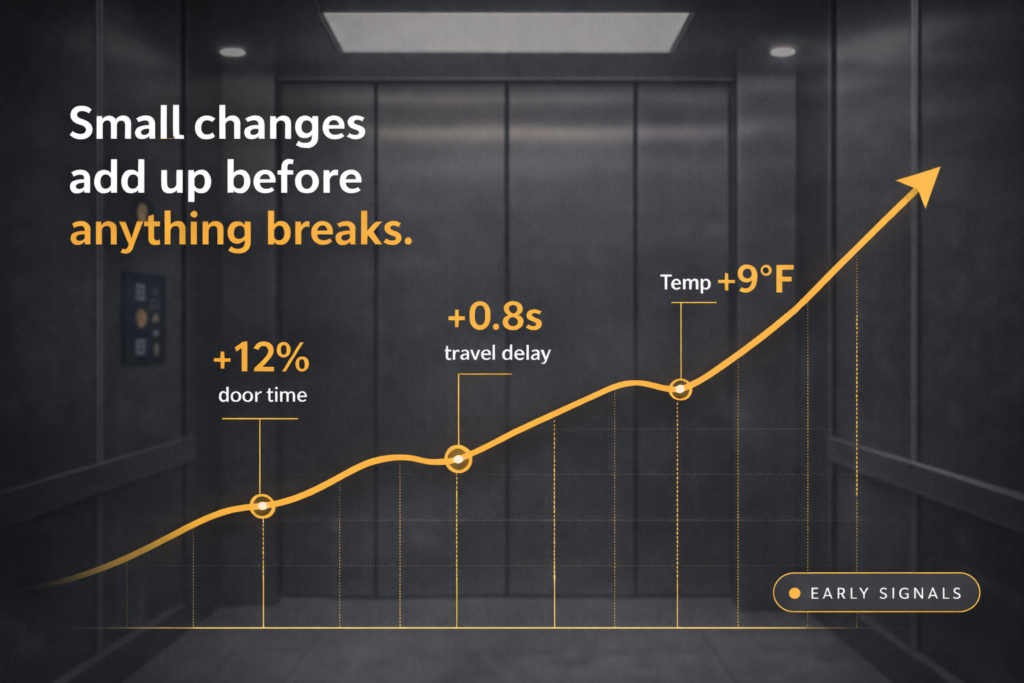
Here’s what that can look like in real terms:
- Door cycle time increases by 12–18% over 60 days
→ Early sign of operator wear or alignment issues - Average trip time between floors increases by ~0.5–1 second during peak hours
→ Could indicate load strain, dispatch inefficiency, or control system lag - Motor temperature trends 8–10°F higher under the same usage conditions
→ Often a precursor to premature component failure - Call volume spikes at consistent times (e.g., 8:45–9:15 AM)
→ Not a mechanical issue—but a traffic flow or scheduling bottleneck
None of these would typically trigger an urgent alert.
But they’re often the first indicators that something is drifting.
What Most Buildings Are Missing
Here’s the part that often goes overlooked:
Elevator data isn’t just about maintenance.
It’s about behavior.
When you start looking at trends over time, you can begin to understand:
- Which elevators are being overused—and when
- Where traffic bottlenecks consistently form
- Whether perceived “slowness” is mechanical or operational
- How dispatch logic is actually performing in real-world conditions
In some cases, the issue isn’t the equipment at all.
It’s how the system is being used.
And without the data, those distinctions are almost impossible to make.
The Difference Between Activity and Insight
Most buildings already have activity:
- Logs
- Alerts
- Monthly service reports
But insight requires something different.
It requires context.
Not just:
“What happened?”
But:
- Is this trend consistent or isolated?
- How does this compare to the last 30, 60, 90 days?
- Is this happening across all cars—or just one?
- Does this pattern correlate with time of day or traffic load?
Without that layer, data becomes noise.
With it, it becomes direction.
How to Actually Use the Data (Without Overcomplicating It)
You don’t need a complex system to start getting value.
But you do need a more intentional way of looking at what you already have.
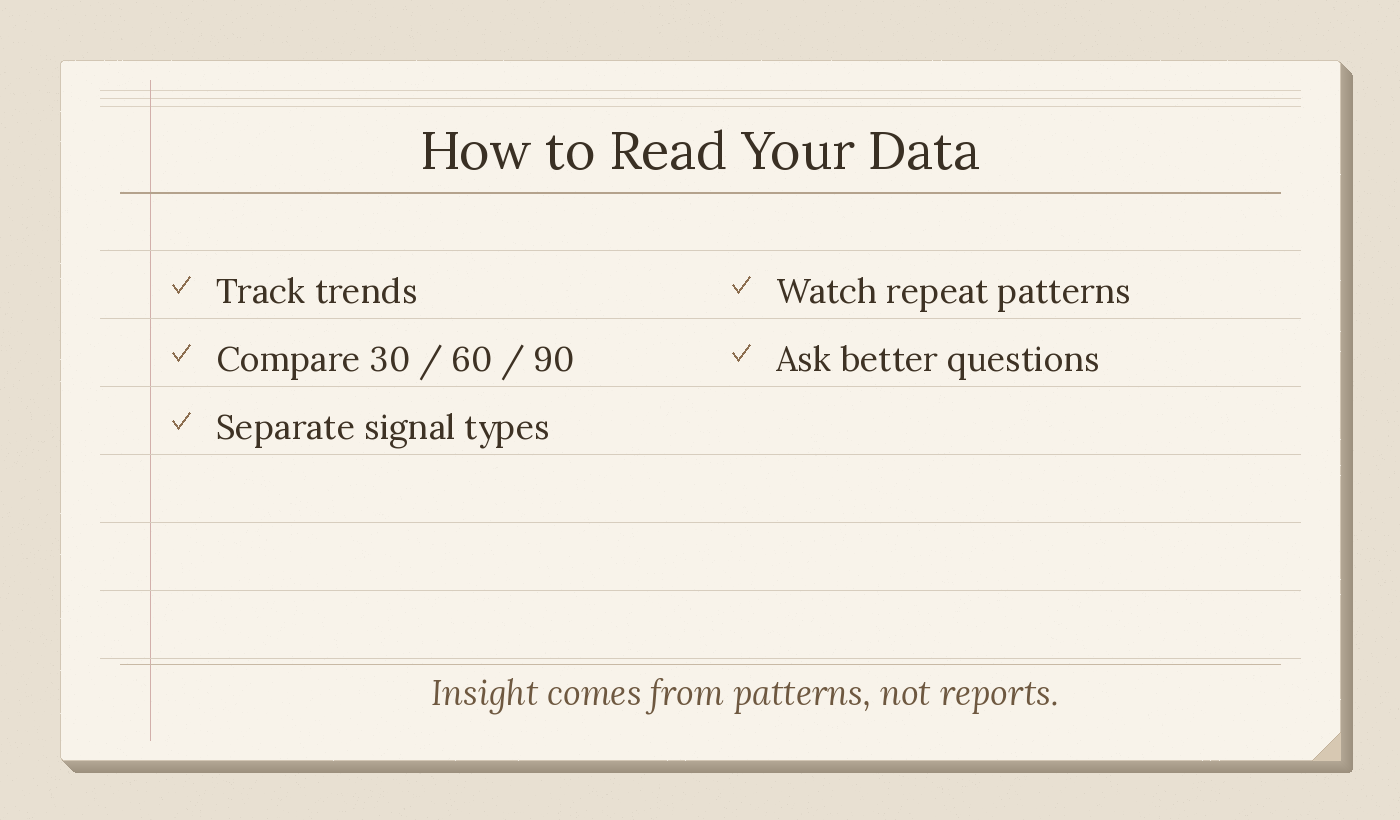
Here are a few practical ways to begin:
1. Track Trends, Not Just Events
Instead of reviewing individual alerts, look at:
- Door cycle times over time
- Trip durations during peak vs off-peak
- Repeated minor faults on the same component
Even a simple monthly comparison can reveal drift.
2. Review Data in 30–60–90 Day Windows
Most issues don’t show up in a single report.
Looking at rolling timeframes helps you spot:
- Gradual performance decline
- Seasonal or usage-based patterns
- Recurring “almost problems”
3. Separate Mechanical vs Usage Signals
Not every issue is a repair issue.
Ask:
- Is this tied to equipment…or traffic flow?
- Is one elevator carrying more load than others?
- Are peak-time delays predictable?
This can prevent unnecessary service calls—and uncover operational fixes instead.
4. Identify “Repeat Offenders”
If the same car or component keeps showing minor irregularities, that’s often more telling than one major failure.
Small, repeated signals usually point to:
- Early-stage wear
- Misalignment
- Or a system that’s compensating for something else
5. Ask for Context, Not Just Reports
Most service reports tell you what happened.
Fewer explain what’s changing.
A better question to ask is:
“What are you seeing that isn’t a problem yet—but is trending that way?”
That’s where the real value lives.
Where This Changes Decision-Making
When data is interpreted correctly, it starts to shift how decisions are made.
Instead of reacting to failures, you start identifying:
- Components that are wearing faster than expected
- Systems under strain due to usage patterns
- Opportunities to rebalance traffic or adjust performance
It also changes how you think about cost.
Because not all expenses are tied to breakdowns.
Some are tied to inefficiencies that go unnoticed for years.
The Bottom Line
Elevator systems are constantly communicating.
The question is whether anyone is actually listening beyond the obvious signals.
The real value of data isn’t in catching failures.
It’s in recognizing the patterns that lead to them—and the opportunities to improve before they ever show up.